
Two Real-World Performance Incidents and How We Solved Them
We all face performance issues at some point: a long-running process, a process that never finishes, or workflows that silently fail under load.
In this article, I share two challenges I faced with one of my clients, the solutions we implemented, and what I learned from both incidents.
Introduction
This article is based on personal experience and reflects my own perspective on handling performance problems in production systems.
What is this about?
I will walk through two performance issues I faced in production projects: what the problems were, how we investigated them, and how we solved them. At the end, I will share the approach I now apply to similar challenges.
Before you continue, take a moment to reflect on what code optimization and performance improvement mean to you.
First Challenge
Project description.
Project A was an event-driven backend solution developed as a mapping bridge between two major client platforms. It ran on Kubernetes and contained four major processes. Each process was a worker running a state machine that handled a different type of workload.
We implemented one process at a time, shipped it, and then moved to the next.
For our first process, this was the flow:
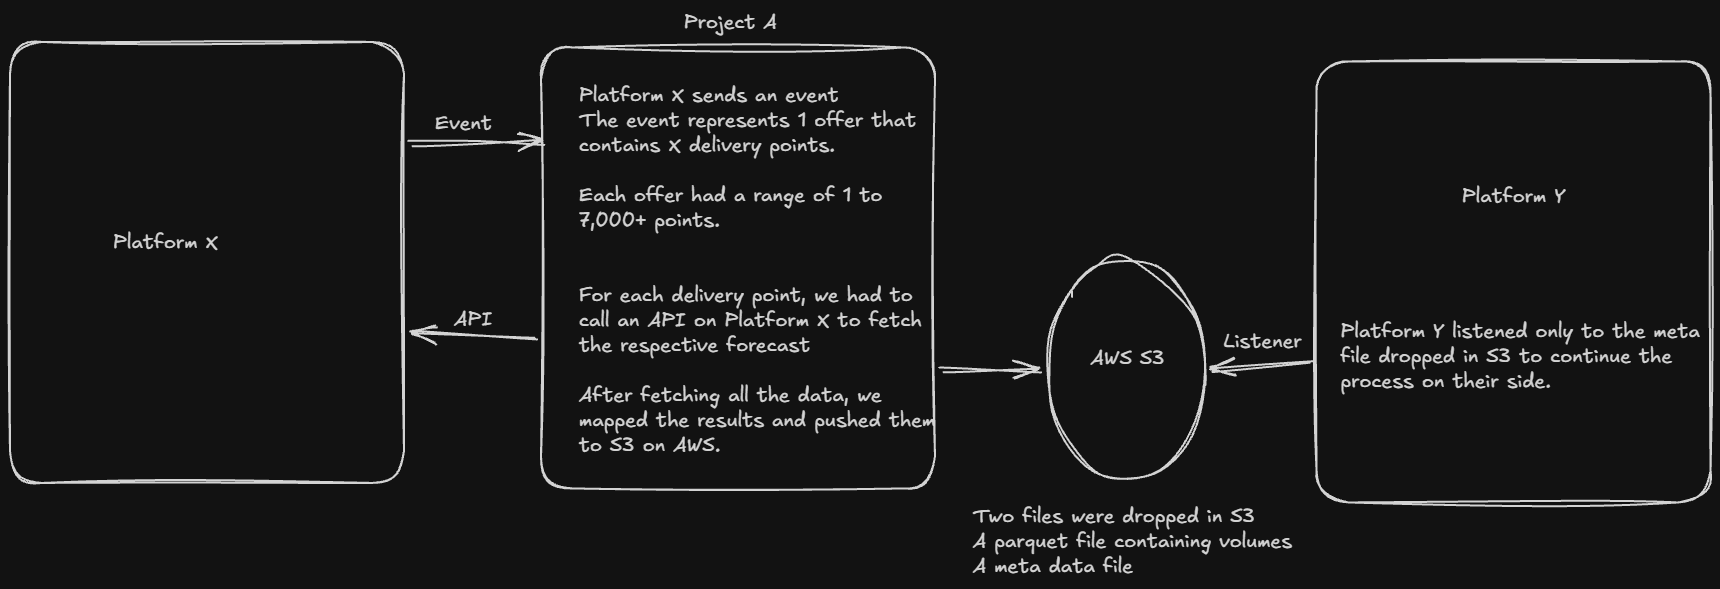
Whenever we received an event from the first platform, we had to fetch all the corresponding data, map it in a way for the second platform to consume and push it to S3 on AWS.
In order to fetch the data for an event, we had to call one API endpoint on the first platform as many times as needed wich was equal to the numbers of delivery points in the respective event.
What happened?
During our internal testing phase, everything was working great, however, we haven’t tested big events due to the time they’d take during development.
The time for the first dry run arrived, and we were confident. Sadly, after the first dry run that confidence took a big hit.
- Process was failing for almost 20% of the events.
- There was no error.
- There was no explanation.
Investigation
Each step in our state machines had at least two logs:
- An entry log
- An exit log (For both happy path, and exceptions)
For the processes that were failing, there was no exit log.
After looking over all different logs (hosting, APIs, and infrastructure), we finally found out that the k8s pod was restarting due to high memory usage, and once restarted, the whole process stopped and couldn’t continue.
The volume of fetched data was simply too large to hold in memory at once, so this had to be fixed.
Desired result
Our fix had to take into account three main points:
- Reduce memory usage.
- Process must complete.
- We can’t use more than one meta data file per event.
and one bonus point:
- If a failure occurs, we should be able to restart from the last completed point.
Steps taken
Before touching code, I usually follow these steps:
- Measurements (to find where the spikes were)
- Draw solutions on a paper
- Pick one
- Implement it
- Measurements (to find if I got rid of the spikes)
Solution
In this case, we didn’t really care about how much time it’d take the process to run, but our constraint was that we could only deliver one meta file per event. However, we were allowed to use as much parquet file as we needed and this was the key to the following solution:
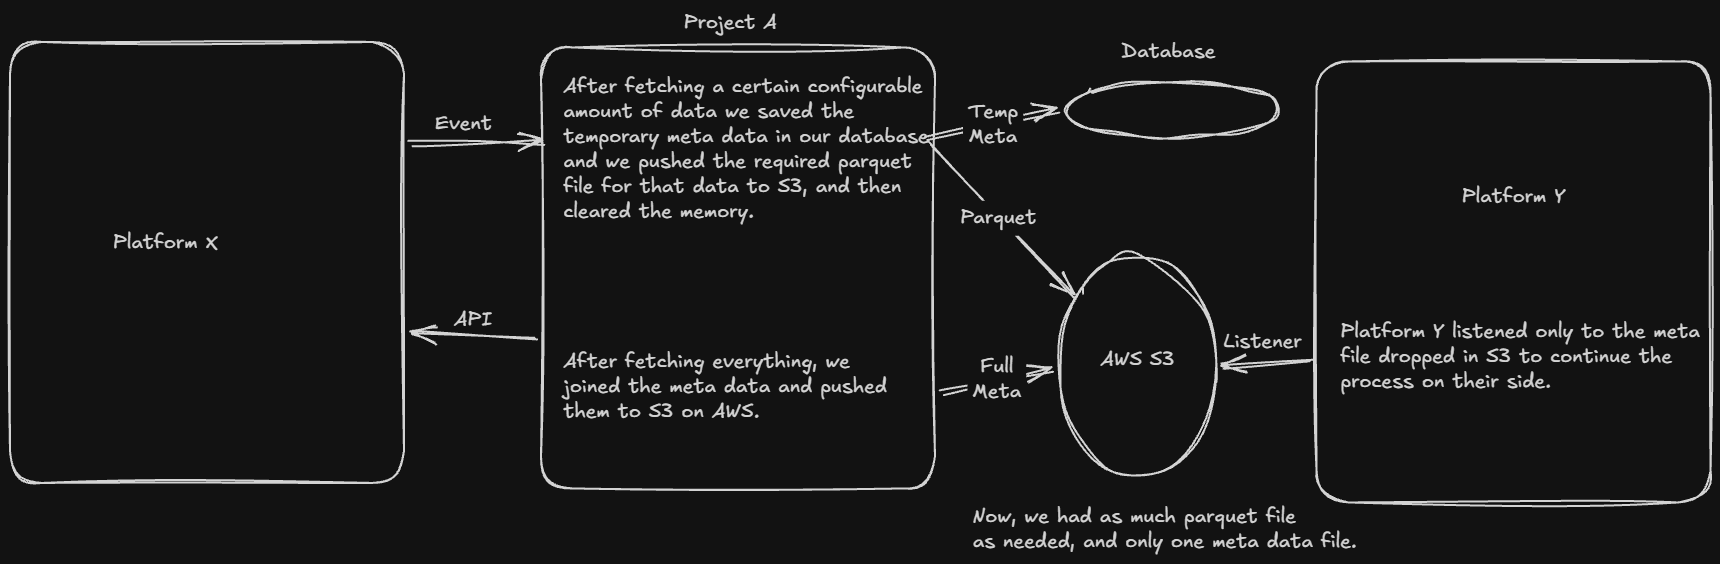
The total time it took between investigating, finding a solution, implementing it, and fully test it was around 8 to 10 working days.
Result
- Events stopped failing
- No more
k8spods restarting due to high memory usage. - Since we were saving our process, we now had the ability to restart the process in case of failure and it would continue from where it stopped.
Second Challenge
Project description.
Project B was an API used to calculate forecasts which eventually led to booking deals in the trading platform. The API was able to handle different processes.
These different processes shared similar steps:
- Calculate
- Fetch position
- Calculate delta
- Book deals
We will look closely into the fetch position step in this case.
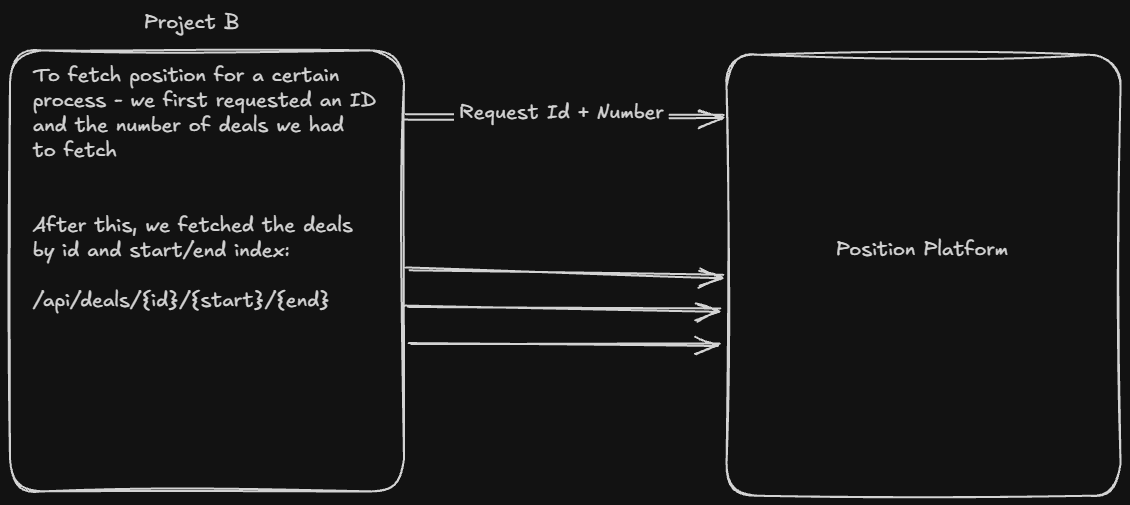
To fetch our current position, we had to fetch the previous deals. We would call the position platform API first to get a request id plus the numbers of deals that existed for a set of parameters. Each process had multiple set of parameters.
The start and end index were an incremental of a hard coded number: 1250. For example, if the numbers of deals returned was 4,523, we had to call the second API four times:
| Start Index | End Index |
|---|---|
| 0 | 1250 |
| 1251 | 2501 |
| 2502 | 3751 |
| 3752 | 4522 |
What happened?
The process was taking too much time to finish.
For a huge number of deals, it might have taken more than 50 minutes at least to fetch everything.
Investigation
To understand the issue, I added extensive logging. Then I wrote a log reader to collect metrics from those logs and measure elapsed time between steps (logs were plain text files at the time).
After multiple tests and measurements, I found the root cause: the API calls were very slow to return results. The bottleneck was not on our side, but it was affecting testing and delaying delivery, so we still needed to mitigate it.
Desired result
The objective was clear. Reduce the process time as much as possible from our side.
Steps taken
Again, before changing and touching the code, I took the following steps:
- Draw solutions on a paper
- Pick one
- Implement it
- Measurements (to find if I got rid of the slowness)
Solution
Since each process had multiple set of parameters, and each set of parameters ended up with multiple API calls, I decided to run all of that in parallel.
I’ve added a new configuration table in our database that contained:
- How many sets we can run in parallel.
- How many ranges (start-end) calls we can run in parallel.
When we got to the position step, we fetched this configuration, and ran all our API calls in parallel.
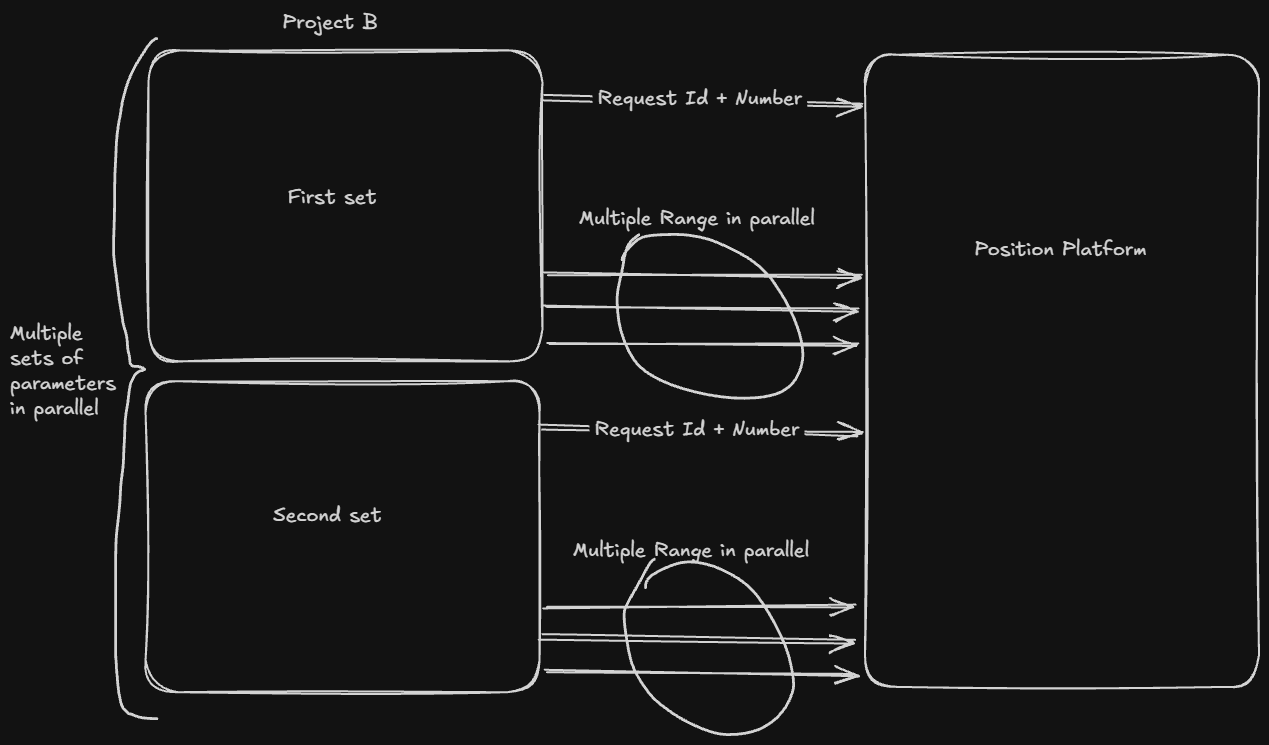
The total time it took between investigating, finding a solution, implementing it, and fully test it was around 5 to 7 working days.
Result
The fetch-position step dropped from about 50 minutes to around 5 minutes.
What happened next?
For project A the solution has been used for all processes to avoid further memory issues, and it’s still running to this date.
For Project B, the position platform team later fixed bugs in their own system, and responses dropped to seconds. At that point, our parallelism optimization was no longer necessary. Still, it was the right mitigation based on the constraints and information available at the time.
Conclusion
After facing these issues I’ve always followed the same approach when facing similar challenges.
- Study the code in depth.
- Measure
- Find the bottleneck.
- If the issue is external, communicate with the third party - if possible.
- Draw solutions on paper (highly advised)
- Imeplement
- Test and measure again
- Repeat if needed
- Deliver
and here’s my definition of code optimization:
tags: performance - backend - kubernetes - api-latency - parallelismIt’s about finding the most effective method to meet your needs. Ensuring it’s as swift as possible while minimizing the risk of failures. At its core, it’s all about efficiency. To optimize code and enhance performance: you must deliver an efficient solution that truly does the job.